พอดีผมไปอ่านบทความของ web ลุงโฉลกก็ไปสนใจค่าอย่างนึง แต่ผมก็พยายามหาข้อมูลแต่ก็หาได้ค่อนข้างยาก แต่ผมว่า น่าสนใจมากในการใช้ดู economic cycle ครับ และยังมีประโยชน์ในการเล่นหุ้นในระยะยาวด้วย ต่อไปนี้ผมจะเอาบทความที่ผมหาเจอมาลงไว้ จะมีมาจากหลายๆที่ ซึ่งก็น่าสนใจทั้งหมดเลยครับ เราจะได้หาจุด turning point และจะได้ระวัดระวังมากขึ้น ในการระวังจุดกลับตัวครับ เรามาดูกันครับ
Leading Economic Indicators
Leading economic indicators predict where the economy is headed. A prime example of a leading indicator is the stock market. Stock prices take into account investor expectations. High expectations produce higher prices while dashed expectations lead to sell-offs. Interest rates and yield curves have predictive value, as do foreign-exchange rates and raw materials prices. The Census Bureau’s durable goods and housing starts data are other examples of leading indicators. Durable goods data gauges heavy industry strength and demand for items designed to last three years or more. Housing starts see a pick up in activity as the business cycle expands. The Conference Board, a not-for-profit organization that identifies peaks and troughs in business cycles in the U.S and eight other countries around the world, releases a Leading Economic Indicator (LEI) series considered the industry standard.
Coincident Economic Indicators
Coincident indicators define where the economy is right now. Examples include industrial production figures compiled by the Federal Reserve Bank, construction spending and new home sales tracked by the Census Bureau, along with manufacturing and trade sales and retail sales. Personal income, consumption and retail sales are monthly barometers of where the consumer fits in relation to the current state of the economy. The Bureau of Labor Statistics releases inflation data on both the wholesale (producer price index) and retail (consumer price index) level. The Conference Board considers some of this activity when calculating its coincident economic indicator and releases this data along with its monthly LEI series.
Lagging Economic Indicators
Lagging indicators show how the economy has performed. The two most widely followed pieces of the economic puzzle are both rear-view mirror depictions of economic activity while garnering the most attention. The unemployment rate is calculated by the Bureau of Labor Statistics (BLS) and released in its monthly Employment Situation Report on the first Friday of the month. The data covers the preceding month and includes the number of jobs created or lost as a coincident indicator and average hourly earnings and average hourly work-week, a leading indicator. The quarterly Gross Domestic Product (GDP) report comes from the Bureau of Economic Analysis (BEA) and represents the market value of all goods and services produced by the economy during the period measured, including personal consumption, government purchases, private inventories, paid-in construction costs and the foreign trade balance (exports minus imports). The data is for the previous quarter and is subject to revision. The most recent report showed the U.S. economy contracting at an annual pace of 6.2% in the fourth quarter of 2008, compared with a 0.5% third quarter contraction. Conventional wisdom defines two back-to-back negative quarters of growth as a recession.
http://economics101.suite101.com/article.cfm/important_us_economic_indicators
อันนี้เป็นตัวอย่างการวิเคราห์ที่เอามาจาก web คุณลุงโฉลกครับ
ตลาดอเมริกามีผลต่อตลาดอื่นๆทั่วโลก รัฐบาลอเมริกากู้หนี้ยืมสินจนไม่สามารถนับปริมาณหนี้สินได้แล้ว เฉพาะดอกเบี้ยอย่างเดียวก็ต้องพิมพ์ธนบัตรเพิ่มเพื่อนำมาชำระหนี้ แต่เพราะความที่เงินดอลล่าร์เป็นสกุลเงินของโลก ค่าของเงินดอลล่าร์จึงยังคงแข็งค่าอยู่ (ชั่วคราว) บัดนี้จีนได้เพิ่มค่าเงินหยวนขึ้นอีก นั่นก็คือการด้อยค่าของเงินดอลล่าร์อย่างหลีกเลี่ยงไม่ได้ สิ่งที่น่าสนใจคือสภาวะเศรษฐกิจของอเมริกา ที่ทำท่าว่าจะเป็น Double Dip Recession

Leading Economic Indicator (LEI) พุ่งขึ้นสูงสุดในเดือนมีนาคมปีนี้ LEI แสดงการ เพิ่ม/ลด ค่า เป็น Percentage ของเดือนเดียวกันเมื่อปีที่ผ่านมา ถ้าค่า LEI ลดลงมาต่ำกว่าศูนย์ แสดงว่าเกิด Recession ปัจจุบันค่า LEI ลดจาก 11.6% in March เหลือ 10.4% in April และ 9.2% in May ถึงแม้ว่าค่า LEI ยังสูงอยู่ แต่การเปลี่ยน Trend ก็เกิดขึ้นชัดเจนแล้ว ถ้า Trend นี้ไม่เปลี่ยน อีกไม่นานก็จะเกิด Recession ในอเมริกา ซึ่งจะส่งผลไปทั่วโลก

The ECRI Weekly U.S. Leading Economic Index ลดลงไปแตะระดับเส้น Recession แล้ว ถึงแม้ ECRI จะยังไม่ตัดเส้น Recession ลงไป แต่ก็ไกล้มากแล้ว Recession อาจจะเกิดขึ้นในอนาคตอันไกล้ ซึ่งเมื่อถึงเวลานั้น ตลาดหุ้นจะทรุดตัวลงทั่วโลก ถึงแม้ตลาด SET จะยัง Bullish อยู่ก็ตาม สัญญาณของ Double Dip Recession ได้เริ่มขึ้นแล้ว สมาชิกเฝ้าดูสัญญาณจาก SET ให้ดีนะครับ เมื่อระบบเปลี่ยนสีเป็นสีแดง หวังว่าพวกเราคง Stop กันทุกคน (แล้ว Short TFEX) นะครับ
ที่มา http://www.chaloke.com/article/835-2010-06-24-10-40-03.html
แล้วก็อีก web ครับที่ให้ข้อมูลที่น่าสนใจ และเป็น LEI ของไทยครับ
วันนี้ผมจะขอพูดถึงดัชนีชี้นำเศรษฐกิจ (Leading Economic Indicator : LEI)
และดัชนีพ้องเศรษฐกิจ (Coincident Economic Indicator : CEI) ซึ่งเป็นดัชนีในรูปแบบของ
การนำดัชนีชี้วัดเศรษฐกิจหลายๆ ดัชนีมาผสมกันจนเป็น Composite Index
โดย LEI นั้นจะทำหน้าที่คาดการณ์หรือบอกภาวะเศรษฐกิจล่วงหน้าประมาณ 3-4 เดือน
ในขณะที่ CEI นั้นจะบอกภาวะเศรษฐกิจในปัจจุบันครับ การอ่านค่า LEI ร่วมกับ CEI นั้น
อาจจะทำให้เพื่อนๆ สามารถคาดการณ์ทิศทางเศรษฐกิจของบ้านเราอย่างคร่าวๆ ได้ ด้วยตัวเอง
ทำให้เราเอาไปใช้ประกอบในการรับฟังข่าวสาร แล้วก็ตัดสินใจในเรื่องอื่นๆ เช่นการลงทุนของเราได้ดีขึ้น
.
LEI และ CEI ใช้ทำอะไร ?
ผมขอ quote คำพูดของเอกสารเผยแพร่จากธนาคารแห่งประเทศไทยมาให้อ่านเลยนะครับ
ดัชนีชี้นำฯ นี้มีประโยชน์ในการดูจุดวกกลับ (Turning-Point) หรือจุดสูงสุด (Peak)
และต่ำสุด (Trough) ของวัฏจักรเศรษฐกิจ และใช้คาดการณ์แนวโน้มเศรษฐกิจ
3-4 เดือนข้างหน้าเป็นสำคัญ อย่างไรก็ตาม การตีความดัชนีชี้นำฯ
ต้องมีความระมัดระวังและควรวิเคราะห์ที่แนวโน้มหรือระดับอย่างต่อเนื่อง
ไม่ควรวิเคราะห์ระดับเป็นเดือนต่อเดือนแบบเน้น Absolute Level
เพราะในการสร้างดัชนีชี้นำฯ มีข้อจำกัดทั้งด้านปริมาณ และคุณภาพของข้อมูล
ซึ่งข้อมูลในประเทศไทยนั้น มิได้มีความหลายหลายเพียงพอที่จะสะท้อนเศรษฐกิจได้ครบทุกสาขา
อีกทั้งยังมีข้อจำกัดเนื่องจากองค์ประกอบในดัชนีชี้นำฯ ทุกตัวได้รับน้ำหนักเท่ากันหมด
.
LEI และ CEI สร้างมาอย่างไร ?
อย่างที่ผมได้บอกไปครับว่า LEI และ CEI นั้นเป็น Composite Index
ที่ประกอบด้วย Index ต่างๆ มากมายอยู่ภายใน เรามาดูกันทีละตัวนะครับว่า มี Index อะไรบ้าง
ที่ถูกใช้ประกอบเป็น LEI และ CEI
เรามาเริ่มจาก LEI ก่อนครับ ดัชนีชี้นำภาวะเศรษฐกิจนั้นจะใช้ดัชนีต่อไปนี้
มาประกอบเป็น LEI โดยในการคำนวณนั้น จะให้น้ำหนักกับดัชนีทุกๆ ตัว เท่าๆ กันครับ
- ปริมาณเงินในความหมายอย่างกว้าง (Real Broad Money)
- จำนวนนักท่องเที่ยวต่างประเทศที่เข้ามาเที่ยวในประเทศไทย
- ดัชนี SET Index
- ดัชนีส่วนกลับของราคาน้ำมัน
- มูลค่าการส่งออก
- จำนวนพื้นที่ที่ได้รับอนุญาตให้มีการก่อสร้างใหม่
- เงินทุนจดทะเบียนของธุรกิจใหม่
ในขณะที่ CEI หรือดัชนีพ้องเศรษฐกิจนั้นจะประกอบด้วยดัชนีต่างๆ ดังต่อไปนี้ครับ
- ดัชนีผลผลิตภาคอุตสาหกรรม
- การจัดเก็บภาษีมูลค่าเพิ่ม
- ปริมาณเงินฝากกระแสรายวัน
- มูลค่าการนำเข้า
- ยอดขายรถยนต์
โดย LEI และ CEI นั้นจะถูกจัดทำและเผยแพร่โดยธนาคารแห่งประเทศไทย
ซึ่งล่าสุด เมื่อวันที่ 31 สิงหาคม 52 (เมื่อวานนี้) ก็เพิ่งจะทำการเผยแพร่ LEI และ CEI
สำหรับเดือน ก.ค. 52 ออกมาครับ และผมจะใช้ข้อมูลชุดนี้ล่ะครับ มาสาธิตการอ่านค่าให้ดู
.
มาทดลองอ่านค่า LEI และ CEI กัน
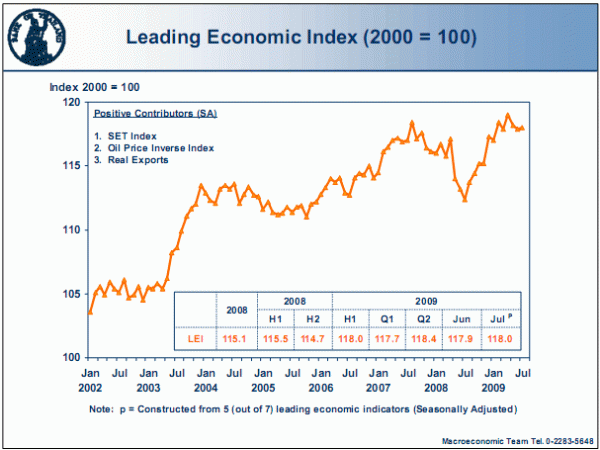
ก่อนอื่นเรามาดูหน้าตาของเจ้ากราฟ LEI กันก่อนนะครับ
.

.
จากกราฟจะเห็นว่าเศรษฐกิจของบ้านเรานั้น มีสัญญาณฟื้นตัวตั้งแต่ช่วงครึ่งปีหลังของปี 2008
โดยสังเกตจากกราฟที่หักขึ้นจากจุดต่ำสุด (ประมาณเดือน ก.ค. 51) หลังจากนั้นก็ดีขึ้นมาโดยตลอด
จนถึงเมื่อเดือน ก.ค. 52 ที่กราฟเริ่มมีการพักฐานบ้างครับ อย่าลืมนะครับว่า กราฟนี้นั้นไม่ได้เป็นภาวะเศรษฐกิจจริง
แต่เป็นสัญญาณบอกเหตุล่วงหน้าประมาณ 3-4 เดือน
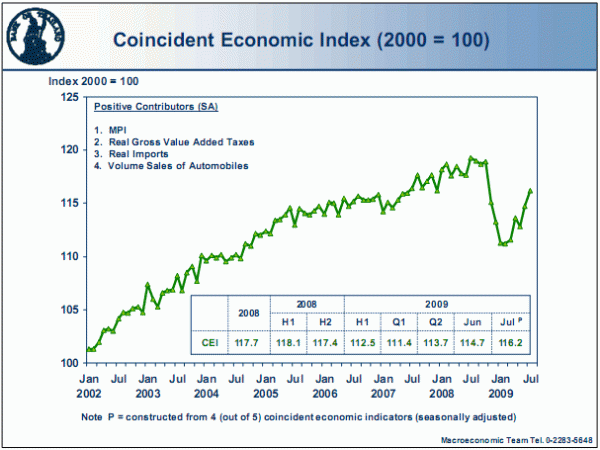
ลองมาดูกราฟ CEI ซึ่งเป็นภาวะเศรษฐกิจจริง ณ เวลาใดๆ กันบ้างครับ ว่าหน้าตาเป็นยังไง
.

.
จากกราฟ CEI จะเห็นว่า เศรษฐกิจบ้านเรานั้น แย่สุดๆ ในช่วงต้นปี 2009 แล้วก็เริ่มมีการฟื้นตัว
ตั้งแต่ช่วงปลายไตรมาส 1 จนถึงปัจจุบันคือไตรมาส 2 ครับ จะเห็นว่าดัชนี LEI นั้นค่อนข้างจะพยากรณ์
การฟื้นตัว หรือการวกกลับของเศรษฐกิจได้แม่นในระดับนึงเลยนะครับ
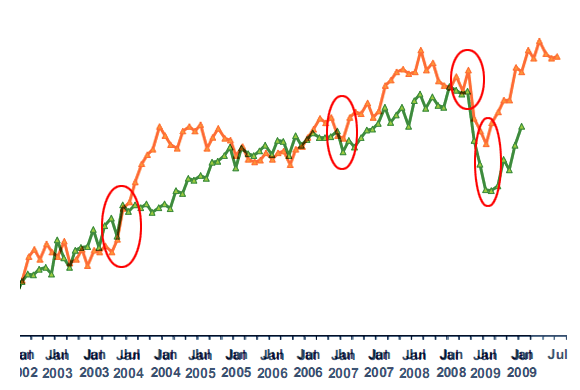
เพื่อให้เห็นภาพมากขึ้น ผมได้ลองขยับกราฟ เลื่อนเวลาของ LEI และ CEI ให้กราฟมาอยู่พ้องกัน
เพื่อสาธิตว่าเราสามารถใช้ LEI ร่วมกับ CEI ได้ดีเพียงใด ลองดูในกราฟด้านล่างนะครับ
.

.
จากรูปนะครับ กราฟเส้นสีส้มคือ LEI (ดัชนีนำ) ส่วนเส้นสีเขียวคือ CEI (ดัชนีพ้อง)
จะเห็นว่า LEI นั้น ส่งสัญญาณบอกทิศทางของเศรษฐกิจได้ค่อนข้างดีเลยนะครับ
ลองสังเกตในวงสีแดงๆ ที่ผมวงไว้นะครับ ขนาดหรือ magnitude ของการเปลี่ยนแปลง
อาจแต่งต่างไปบ้าง แต่ทิศทางโอเคครับ
ซึ่งถ้าเราลองดูในปัจจุบันนะครับ จากการอ่านค่า LEI เนี่ย เราจะพบว่า
เศรษฐกิจบ้านเราในอีก 3-4 เดือนข้างหน้า ก็มีแนวโน้มที่จะฟื้นตัวครับ
พอถึงจุดนั้น ก็อาจจะมีการพักฐานตามลักษณะของกราฟ LEI บ้าง
เราก็ต้องคอยติดตามสัญญาณ LEI ต่อไป ว่าค่าดัชนีนำในเดือนถัดๆ ไปจะเป็นยังไงนะครับ
ถ้ามีการหักหัวลงมาก เราก็อาจจะพอบอกได้ว่า การฟื้นตัวอาจจะเป็น W-Shape
แต่ถ้าขึ้นต่อหรือนิ่งเรียบ ก็จะเป็น V-Shape และ Square-root Shape ครับ
.
บทส่งท้าย
LEI และ CEI ก็เป็น indicator อีกกลุ่มหนึ่ง ที่ผมคิดว่าเป็น indicator ง่ายๆ
ที่เพื่อนๆ ควรให้ความสนใจนะครับ ผมว่าเหมาะมากกับการใช้เป็นเครื่องมือประกอบ
กับการวิเคราะห์ การตัดสินใจอื่นๆ ด้วยกราฟเล็กๆ สองกราฟเนี่ย
เราสามารถเอาไปประยุกต์ใช้ได้หลากหลาย ขึ้นอยู่กับความต้องการของเราเลยครับ
เช่น เอาไปใช้คาดการณ์ผลการดำเนินงานของบริษัท ทิศทางราคาหุ้น ก็พอได้ครับ
และถ้าใครสนใจนะครับ ข้อมูลต่างๆ สามารถติดตามได้ที่เว็บไซต์ของธนาคารแห่งประเทศไทย
ตามลิ้งค์ต่อไปนี้ครับ
.
Reference:
..- รายละเอียดเกี่ยวกับดัชนี LEI และ CEI โดย ธนาคารแห่งประเทศไทย
..- สรุปดัชนีและเครื่องชี้เศรษฐกิจต่างๆ โดย ธนาคารแห่งประเทศไทย
ที่มาครับ http://aphdjourney.wordpress.com/2009/09/01/lei-cei/
อีก web นึงก็คือตัวอย่างการวิเคราห์ LEI และ ECRI และการเกิด double dip recession ที่เมกาครับ
http://www.tradersnarrative.com/should-we-be-more-worried-about-a-double-dip-4241.html
Rather than just update the Google trends search results for “double dip”, I went a step further and compared its weekly results with the weekly Leading Indicator index from the ECRI for the past 12 month period:
We still see the two spikes from last year - the first in August 2009 and the second in November 2009. To understand the chart, I should explain that the Google Trends data is relatively scaled. This means that each point is presented relative to the average over the time period (12 months). So the most recent data point from last week at 3.38 means that searches for “double dip” last week were 3.38 times that of the average for the past 12 months.
The first spike, signaling an increase in concern about a weakening economy, happened last summer in August. When we compare it to the ECRI’s LEI we see that it was a considerable amount of worry for nothing. If we look at the year over year chart of the LEI we can see that the index was still expanding quite rapidly:
The second spike, showed that people had significantly more concern in mid-November 2009. This was more expected because it was a result of some weakening in the LEI. This brings us to today’s scenario.
The current spike easily surpasses the last one but it comes as a result of a total collapse in the LEI. In fact, we’ve never seen the ECRI LEI fall quite this rapidly.
To give you a bit of perspective to see the large decline better, here is a long term chart (courtesy of Societe Generale research) showing the year over year change in the ECRI’s Weekly Leading Index:

Considering the precipitous fall those dizzying heights, you would be forgiven if you expected all hell to break loose in sentiment. But all in all, our (flimsy) proxy for sentiment has not shown a concomitant rise.
หวังว่าคงได้แนวคิดไม่มาก ก็น้อยนะครับเกี่ยวกับ LEI และ ECRI ครับ แต่ก็เน้นย้ำนะครับว่า ต้องใช้วิเคราะห์ในระยะยาวนะครับ จะได้เพิ่มศักยภาพในการดู trend ด้วยครับ แล้วก็ใช้ควบคู่กับระบบจะ work มากครับ
แต่ผมก็ยังไม่สามารถว่าจะหาดูกราฟ LEI ของเมกาได้ที่ไหน ถ้าใครรู้ช่วยบอกด้วยนะครับ หาไม่เจอจริงๆ อาจจะคอยอ่านตามบทวิเคราห์เอาหรือเปล่าก็ไม่แน่ใจนะครับ ก็หวังว่าคงได้ประโชน์กันมั้งนะครับ
Boyles
ไม่มีความคิดเห็น:
แสดงความคิดเห็น